Marcus Chen thought he had accounted for every detail this far into the design. In March 2025, his team installed eight 64-port 100G spine switches in one enclosure in Hong Kong. They sized the PDUs based on four switches, using the datasheet’s 450-watt-per-switch base power figure. They completely overlooked the optics.
The optics alone added another 2,458 watts: 512 QSFP28 LR4 modules, each rated at 4.8 watts. On the first full-traffic day, the PDU tripped its 30A breaker. The entire rack went dark, and the planned production cutover was delayed by four days.
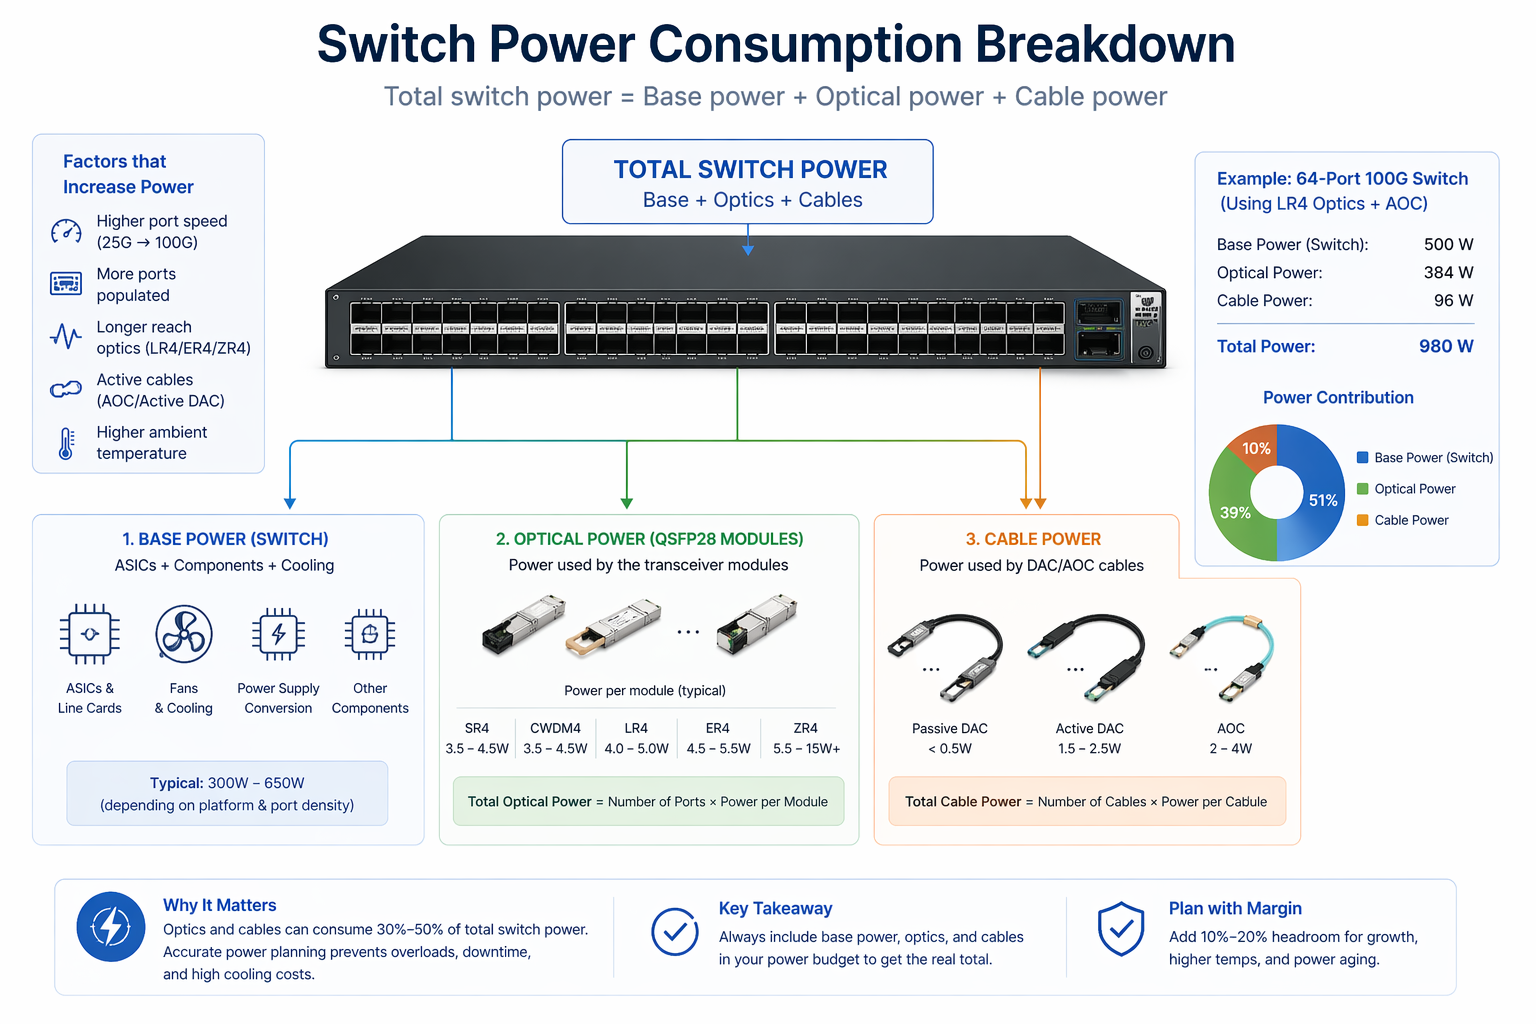
This is why QSFP28 power consumption cannot be an afterthought. At scale, optics can easily double or triple the total power load of a switch. Inaccurate calculations lead to tripped breakers, overheated racks, and expensive retrofits.
In this guide, you will learn exactly how much power a QSFP28 consumes, how it scales from module to rack, and how to properly design your power and thermal infrastructure. You will see detailed power breakdowns by module type, switch-level calculations, cable contributions, and the most common deployment mistakes.
Need help planning your power budget? Explore Ascent Optics’ QSFP28 transceiver portfolio or contact our engineers for a free power and thermal assessment.
How Much Power Does a QSFP28 Module Use?
The power draw of a QSFP28 module depends primarily on its type, reach, and manufacturer. Short-reach modules consume less power, while long-reach and coherent modules draw significantly more.
Power Consumption by Module Type
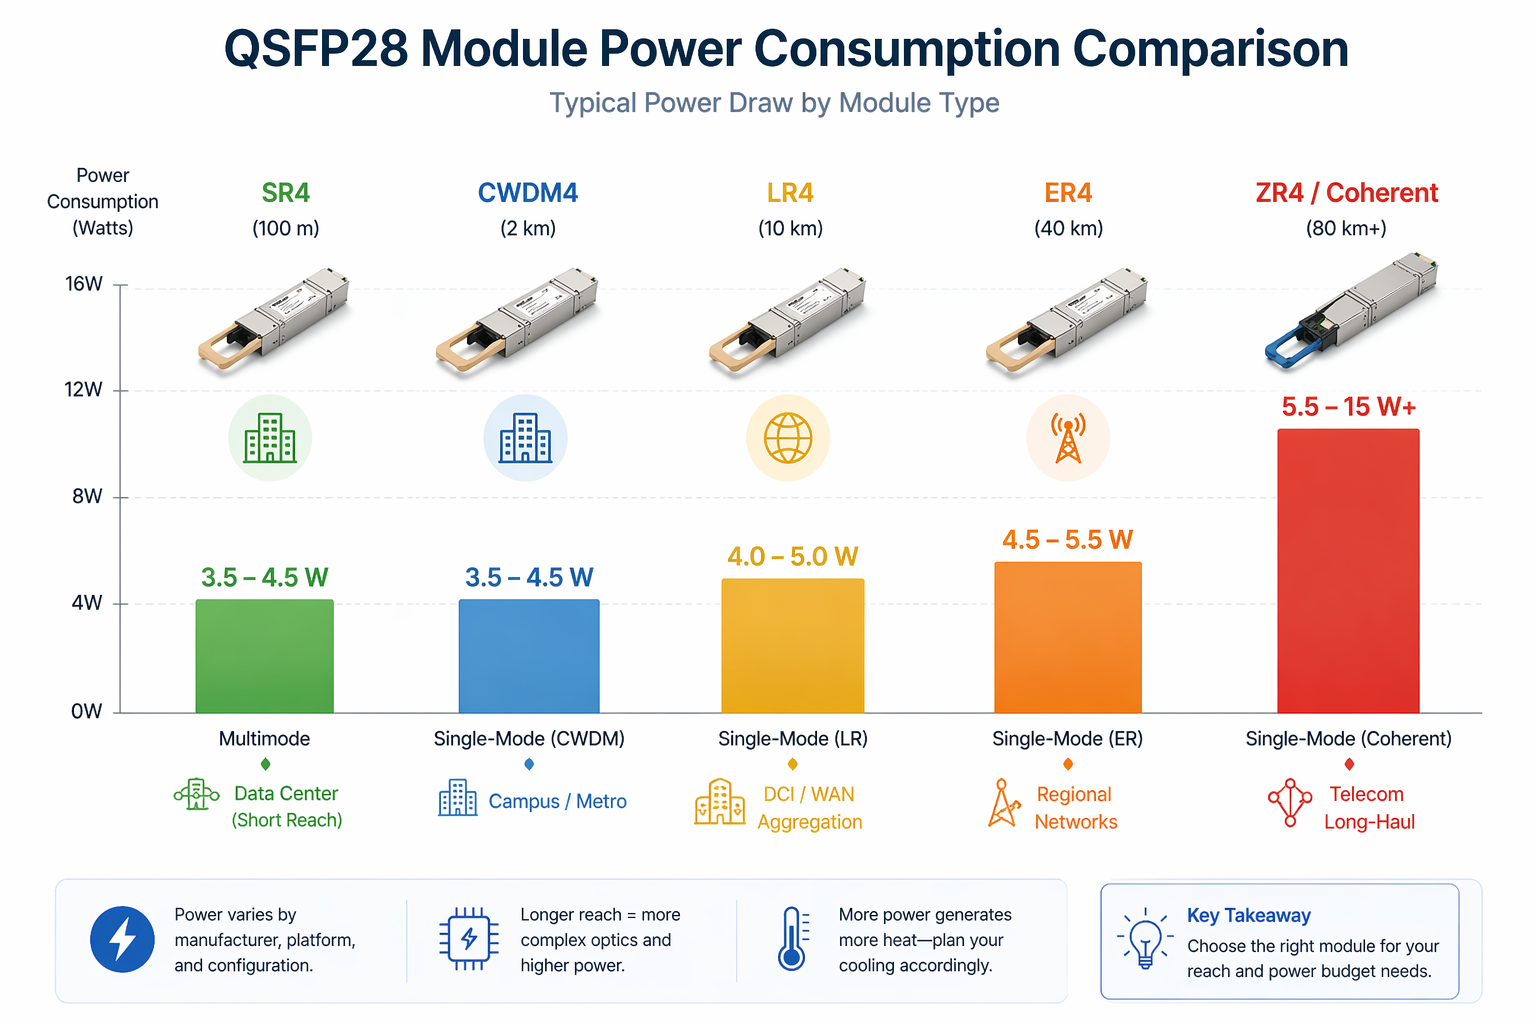
Here are the typical power ranges for common QSFP28 modules:
- •SR4 (multimode, 100 m):5 W to 4.5 W
- •CWDM4 (single-mode, 2 km):5 W to 4.5 W
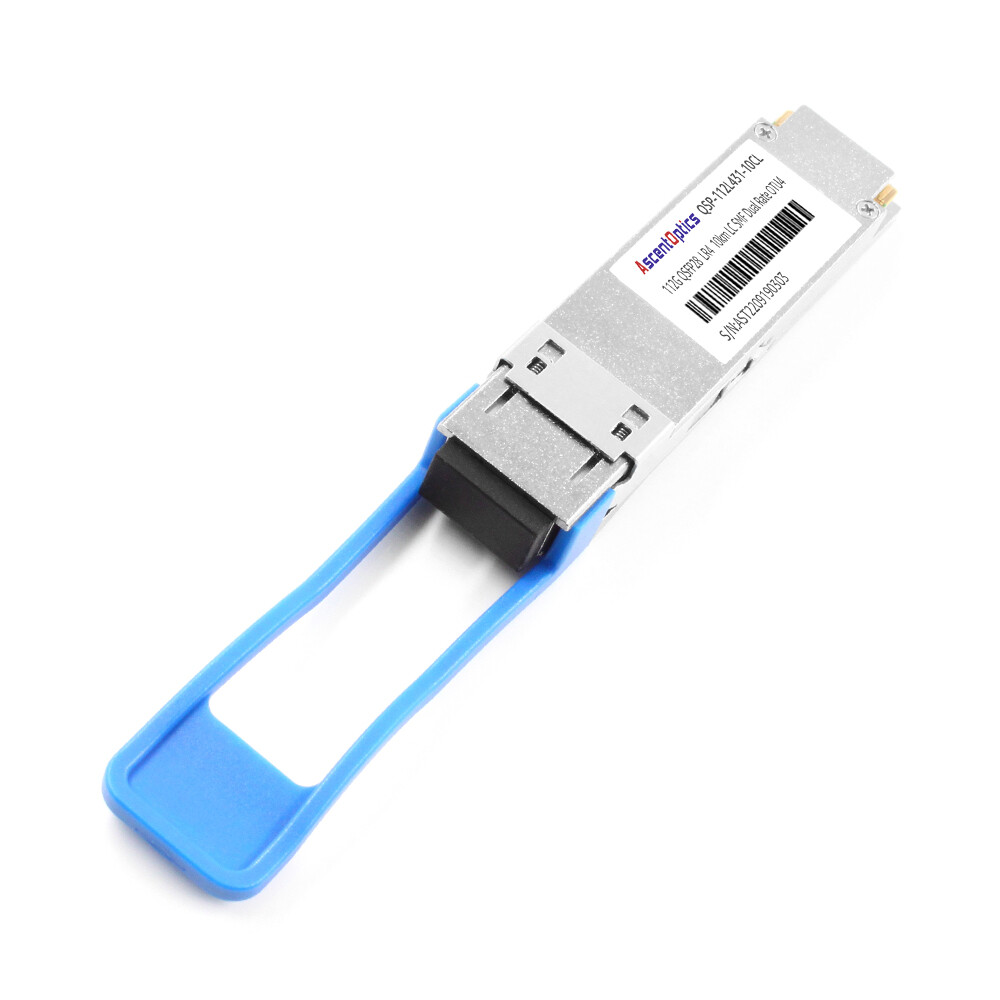
- •LR4 (single-mode, 10 km):0 W to 5.0 W
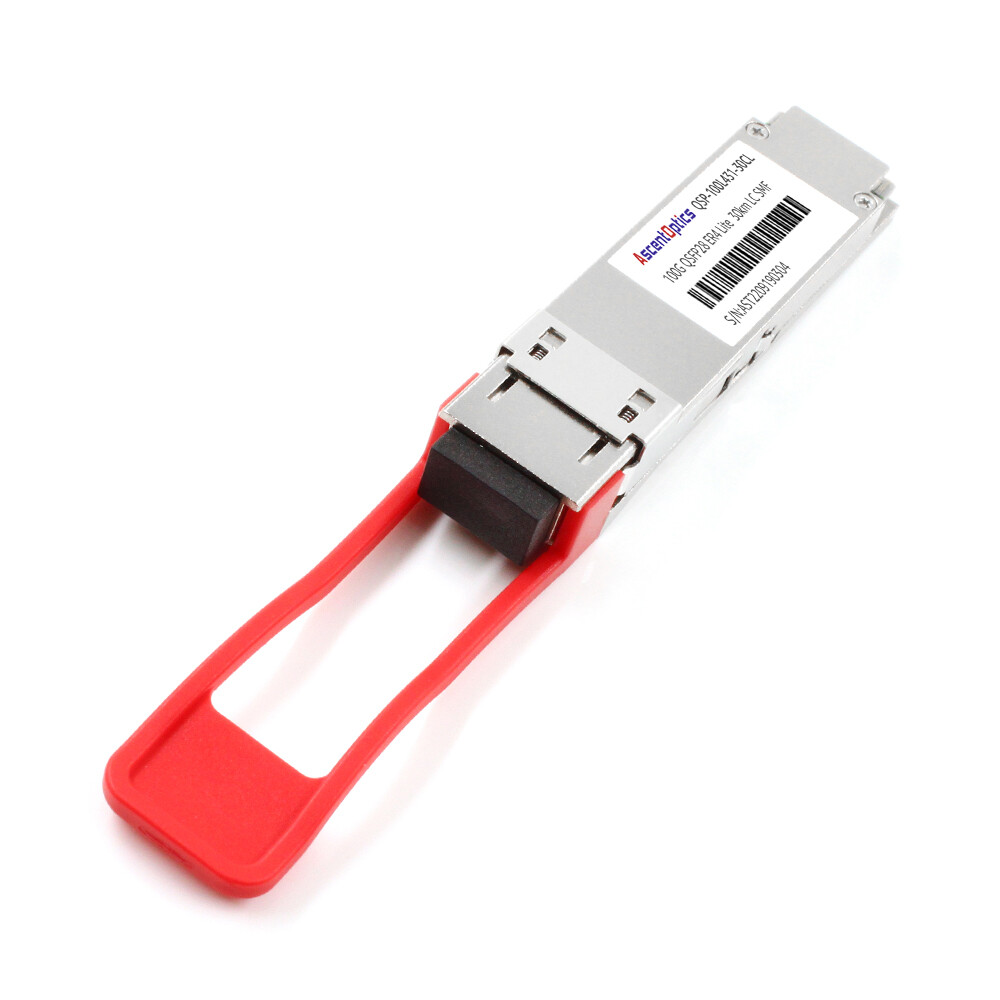
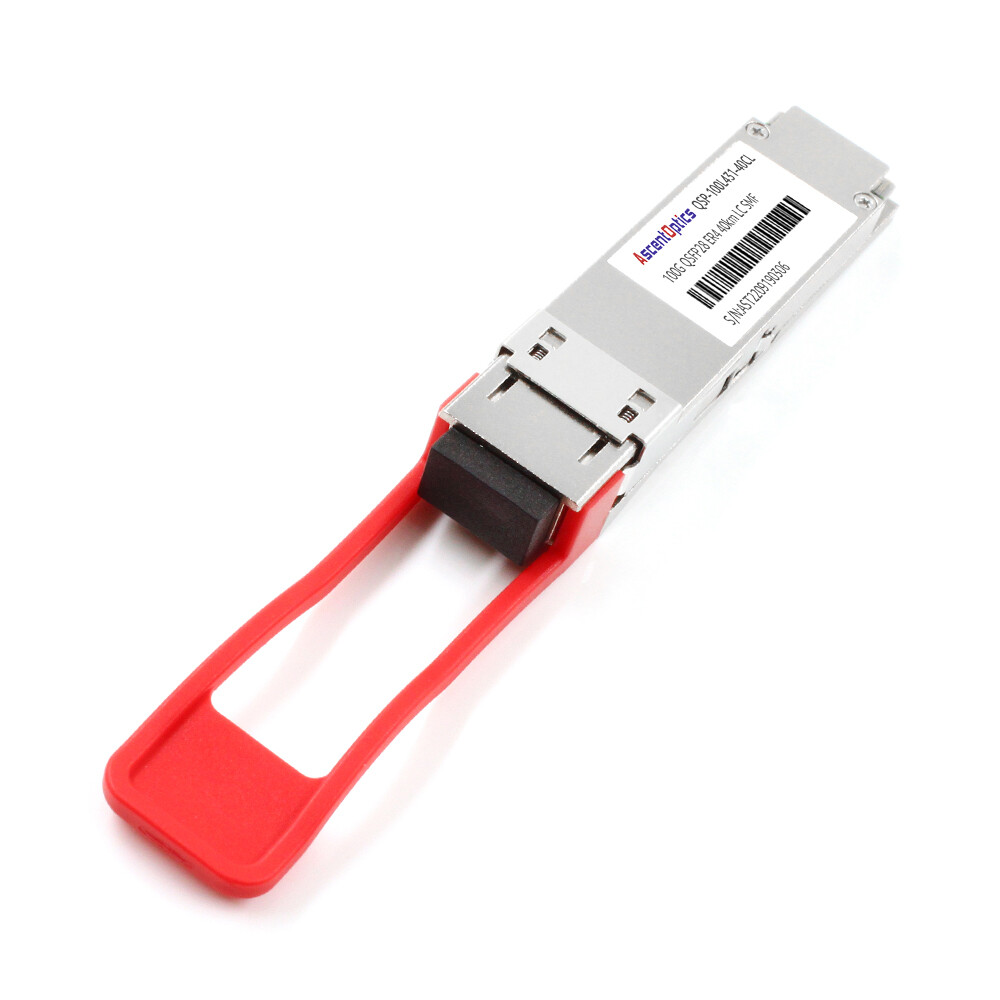
- •ER4 (single-mode, 40 km):5 W to 5.5 W
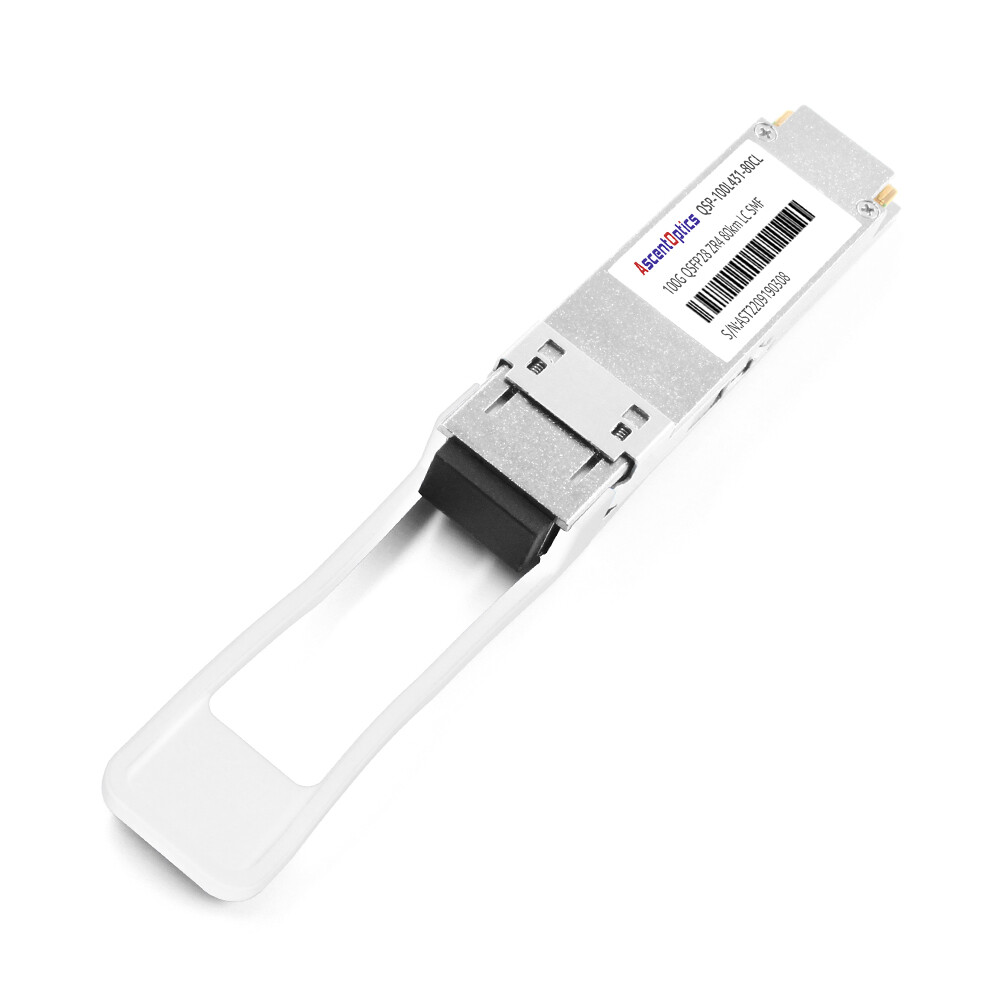
- •ZR4 / Coherent (single-mode, 80 km): 5.5 W to 15 W+
The differences come from the complexity of the optical engine. SR4 and CWDM4 use simpler laser and detector arrays. LR4 and ER4 add wavelength-division multiplexing and more sensitive receivers. ZR4 and coherent modules include digital signal processors (DSPs) that dramatically increase power draw.
Why Long-Reach Modules Use More Power
Long-distance transmission requires higher transmit power, ultra-sensitive receivers, tighter wavelength control, and complex signal processing. For example, a 10-km LR4 module needs stronger lasers and better wavelength stability than a 100-m SR4 module. A 40-km ER4 module adds amplification and dispersion compensation. The DSP in an 80-km ZR4 module can consume nearly as much power as the rest of the optical engine combined.
QSFP28 Module Power Comparison Table
| Module Type |
Typical Power Draw |
Max Reach |
Use Case |
| SR4 |
3.5 W – 4.5 W |
100 m |
Data center spine-leaf |
| CWDM4 |
3.5 W – 4.5 W |
2 km |
Campus / metro |
| LR4 |
4.0 W – 5.0 W |
10 km |
DCI / WAN aggregation |
| ER4 |
4.5 W – 5.5 W |
40 km |
Regional networks |
| ZR4 / Coherent |
5.5 W – 15 W+ |
80 km |
Telecom long-haul |
For a deeper look at each module type, see our QSFP28 module types guide.
Switch-Level Power Budgeting
Module power is only the beginning. You need to aggregate it at the switch level and then at the rack level.
Calculating Total Optical Power per Switch
Multiply the number of populated ports by the average module power draw.
Example: A fully populated 64-port switch with QSFP28 LR4 modules (4.5 W each) consumes 288 watts from optics alone. The same switch filled with SR4 modules (4.0 W each) consumes 256 watts from optics.
Add the switch’s base chassis power (fans, ASIC, etc.), which typically ranges from 450 W to 650 W for a high-port-density 64-port chassis without optics.
How Switch ASIC Power Scales with Port Speed
Switch ASICs consume more power as port speeds increase. This would imply that a 64-port 100G switch ASIC draws significantly more power than a 64-port 40G ASIC, since it must process 2.5 times the bandwidth. Moving to 100G from 40G increases the thermal load by both the optics and the switch silicon.
Example: 32-Port vs 64-Port 100G Switch Power
| Component |
32-Port Switch |
64-Port Switch |
| Base chassis power |
300 W – 400 W |
450 W – 650 W |
| Optical power (SR4) |
128 W – 144 W |
256 W – 288 W |
| Optical power (LR4) |
160 W – 192 W |
320 W – 384 W |
| Total with SR4 |
428 W – 544 W |
706 W – 938 W |
| Total with LR4 |
460 W – 592 W |
770 W – 1,034 W |
Marcus Chen’s team in Hong Kong learned this lesson the hard way. Their eight 64-port switches with LR4 optics each drew more than 900 watts. The rack exceeded 7.2 kW, while their 30A PDU at 208V could only supply 6.24 kW. The missing optical power calculation made the breaker trip inevitable.
The Hidden Power Cost: Cables Matter Too
If you use DAC or AOC cables instead of discrete transceivers, the cables themselves also draw power.
Transceiver Power vs DAC Power vs AOC Power
| Connection Type |
Typical Power Draw |
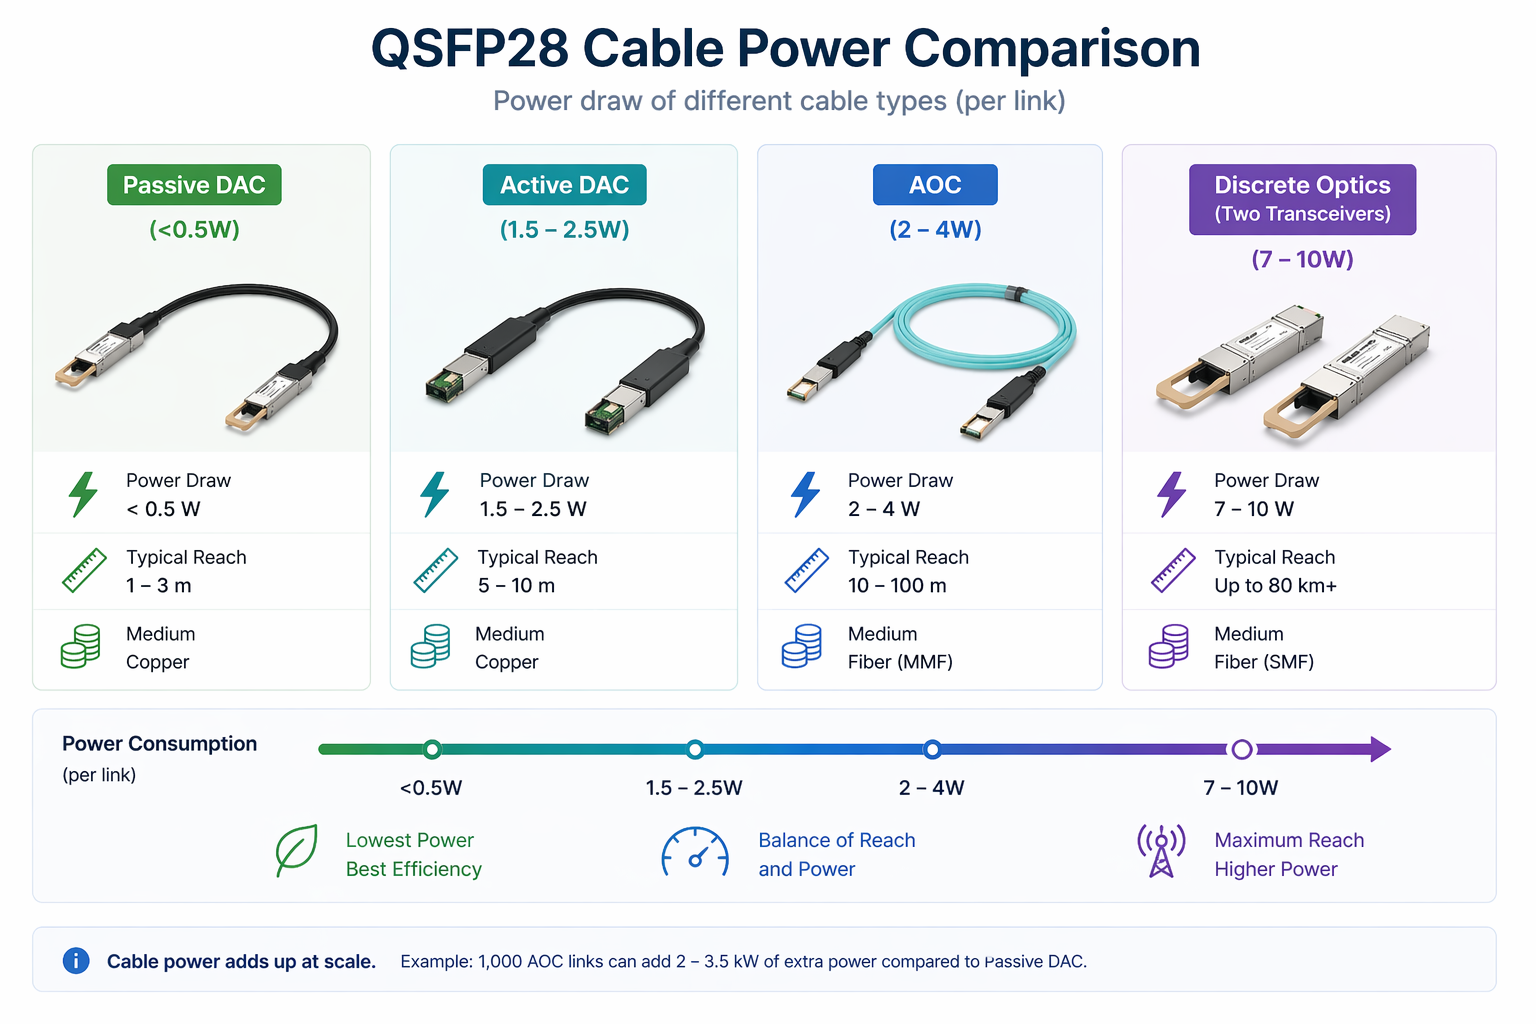
| Discrete QSFP28 transceivers (both ends) |
7 W – 10 W total |
| Passive DAC |
<0.5 W total |
| Active DAC |
1.5 W – 2.5 W total |
| AOC |
2 W – 4 W total |
A passive DAC is essentially a copper cable with no active components, so it draws negligible power. An AOC contains optical engines in both connectors and therefore consumes power comparable to a pair of low-power transceivers.
When Cable Power Changes Your Total Budget
At small scale, cable power is insignificant. At large scale, it matters. Deploying 1,000 AOC links instead of passive DACs can add 2,000 to 3,500 watts.
Sarah Kim led a hyperscale build-out in Ashburn. She budgeted power based only on transceiver specs for 2,000 QSFP28 links. Half the links were under 5 meters and could have used passive DACs, but the other half used AOCs. She missed the extra 3,000 watts from the AOCs. The three racks exceeded their cooling capacity, forcing her to replace 400 AOCs with passive DACs on the shortest links to bring thermal loads back under control.
For a detailed DAC vs AOC comparison, read our QSFP28 DAC vs AOC guide.
QSFP28 Thermal Design for Data Centers
All power consumed by QSFP28 modules or cables ultimately becomes heat that your cooling system must remove.
Converting Module Watts to Rack BTU/hr
Data center cooling is rated in BTU per hour. Convert watts to BTU/hr by multiplying by 3.412.
Example: A rack with eight 64-port switches, each drawing 900 W, produces a total heat load of approximately 24,566 BTU/hr (8 × 900 × 3.412). When cooling systems were designed for lower-density generations, this extra heat can quickly push supply air temperatures beyond ASHRAE recommended levels.
Front-to-Rear Airflow and Hot Aisle / Cold Aisle
High-density 100G switches require consistent front-to-rear airflow. Exhaust air from one switch must not recirculate into the intake of another. In a hot-aisle/cold-aisle layout, align exhaust to the rear and prevent recirculation into the cold aisle.
Blanking Panels and Airflow Management
Missing blanking panels allow hot air to recirculate from the hot aisle back into the cold aisle, disrupting intake temperatures for switches and optics. In high-density 100G racks, installing blanking panels is essential to maintain module temperatures.
Power Efficiency: 100G vs 40G vs 25G
One of the strongest arguments for 100G migration is improved power efficiency per gigabit.
Watts per Gigabit Comparison
| Speed |
Typical Module Power |
Watts per Gbps |
| 10G SFP+ |
1.0 W |
0.100 W/Gbps |
| 25G SFP28 |
1.0 W – 1.5 W |
0.040 – 0.060 W/Gbps |
| 40G QSFP+ |
1.5 W – 3.5 W |
0.038 – 0.088 W/Gbps |
| 100G QSFP28 |
3.5 W – 5.5 W |
0.035 – 0.055 W/Gbps |
Why 100G Consolidation Saves Power
Running two 40G links to achieve 80 Gbps consumes 3 W to 7 W in optics. A single 100G QSFP28 link delivers 3.5 W to 5.5 W while providing 25% more bandwidth. Organizations that consolidate 40G pairs into 100G links typically reduce power-per-bit by 30% to 50%.
For migration planning, see our 40G to 100G migration guide.
Monitoring and Managing QSFP28 Temperature
Modern QSFP28 modules include Digital Diagnostic Monitoring (DDM) that reports real-time temperature, voltage, and optical power.
Reading DDM Temperature Values
Temperature data is accessed via the module’s I²C interface. On most switch operating systems, use the command show transceiver detail (or equivalent) to view the internal sensor reading.
Normal Operating Ranges by Module Type
| Module Type |
Typical Operating Range |
Alarm Threshold |
| SR4 / CWDM4 |
30°C – 60°C |
70°C – 75°C |
| LR4 |
35°C – 65°C |
75°C – 80°C |
| ER4 / ZR4 |
40°C – 70°C |
80°C – 85°C |
When Thermal Alarms Indicate a Real Problem
In a warm environment, ER4 modules may safely run up to 72°C. However, when multiple modules in the same switch approach alarm thresholds, the issue is usually rack airflow or cooling rather than the modules themselves.
If you see thermal alarms after a 100G migration, first check for missing blanking panels, obstructed vents, or hot-air recirculation before blaming the optics.
Need help diagnosing thermal issues? Contact our optical networking experts for troubleshooting support.
Common Power and Thermal Mistakes
Here are the most frequent errors we see in the field:
Undersizing PDUs for Fully Loaded Switches
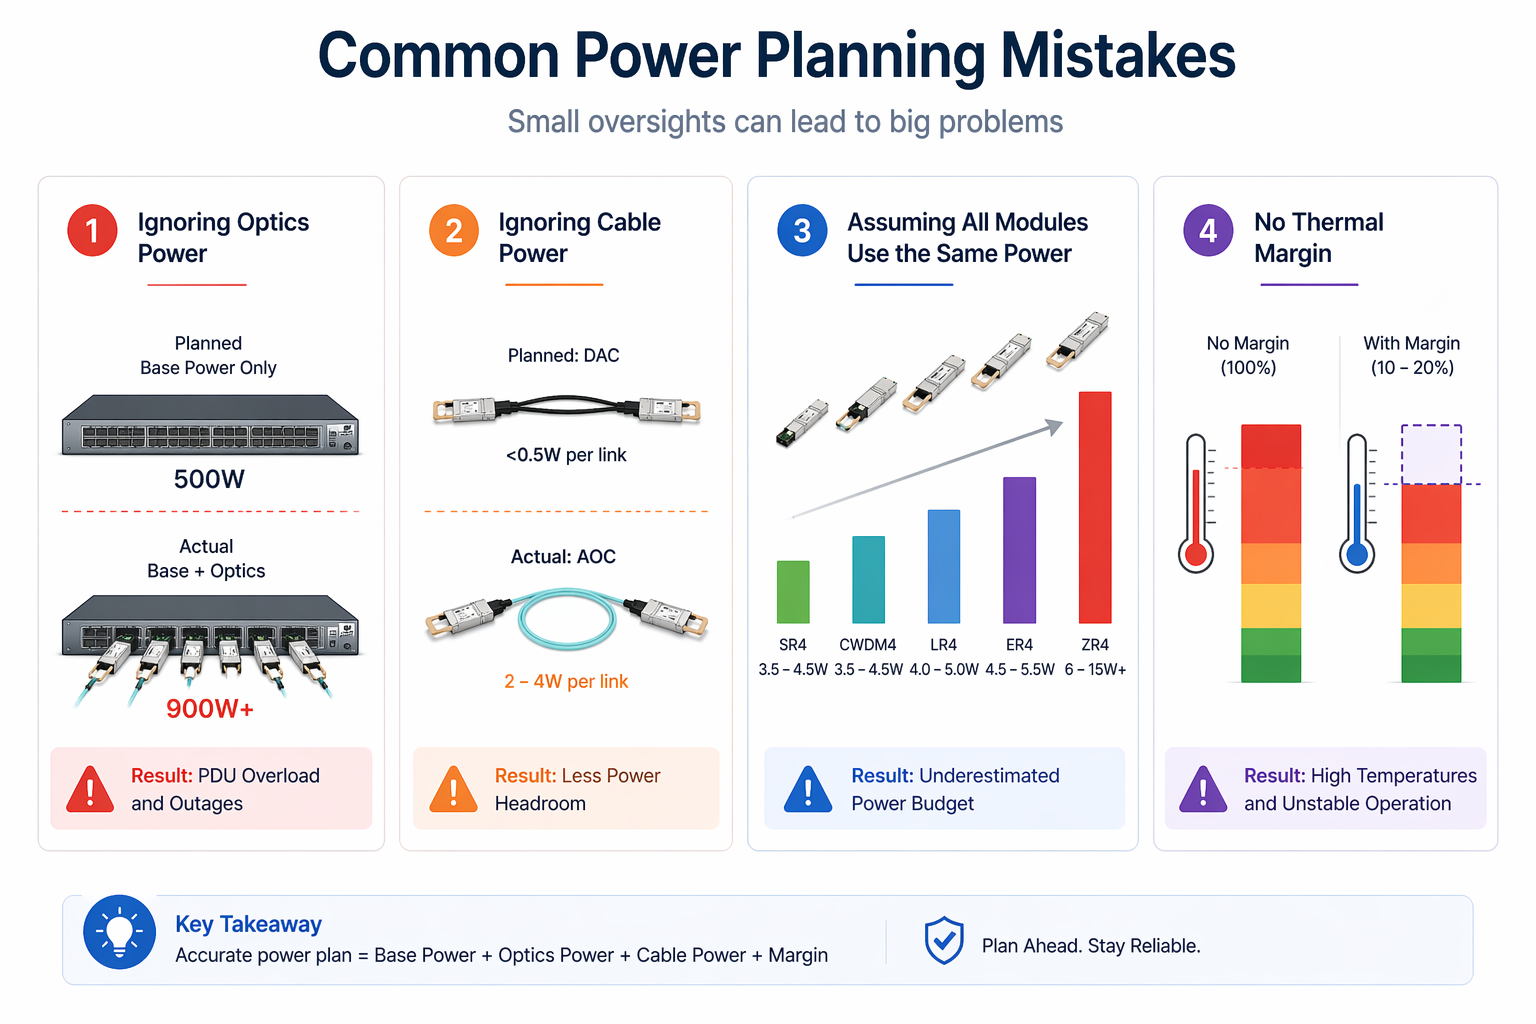
The biggest mistake is sizing rack PDUs based only on the switch’s base power. Always add optical module power and cable power. High-density 100G racks increase total load by 30–50% through optics alone.
Ignoring Cable Power in Total Budgets
As Sarah Kim discovered, AOCs and active DACs draw meaningful power. At scale, the difference versus passive DACs can add thousands of watts.
Assuming All QSFP28 Modules Draw the Same Power
An SR4 module at 4 W handles 100 Gbps signaling, while a ZR4 module at 12 W does the same—but they are not interchangeable in power calculations. Always use the specific module’s rated power.
Neglecting Ambient Temperature Margins
Higher intake air temperatures raise module case temperatures. If your data center runs near the high end of ASHRAE Class A1 (about 27°C), modules can run 5–10°C hotter than in a cooler environment. Build in headroom for summer peaks or cooling failures
Step-by-Step QSFP28 Power Planning Checklist
Use this checklist to avoid the mistakes that trip up deployments.
Step 1: List Every Module and Cable Type
List the exact module and cable types for each link. Avoid general averages at all costs. An array of SR4, LR4, and AOC will give one total different from that gained through equal insertion of uniform type.
Step 2: Calculate Switch Optical Power
Calculate switch optical power by multiplying populated ports by each module’s rated power draw. Sum across all modules.
Step 3: Add Switch Base/Chassis Power
Add switch base/chassis power from the vendor datasheet at your expected traffic load (base power scales slightly with utilization)
Step 4: Convert to Thermal Load
Add optical power, cable power, and base power. Multiply the total by 3.412 to get BTU/hr per switch. Multiply by the number of switches per rack.
Step 5: Size PDUs and Cooling
Make sure your PDUs rack can handle the total electrical load with a margin. Make sure you have a cooling load that can handle the total thermal load with a margin. The rule of thumb comes down to designing for 80 percent of rated capacity for regular normal operations.
Step 6: Plan for Margin and Growth
Leave headroom for future expansion. If you plan to add switches or upgrade modules later, size the infrastructure now to avoid retrofits.
Conclusion
QSFP28 power consumption is not just a module spec—it is a scaling factor that determines PDU sizing, cooling capacity, and rack thermal design. A few watts per module quickly become hundreds of watts per switch and thousands of watts per rack.
Key takeaways:
- •Module type matters. LR4 and ER4 draw more power than SR4 and CWDM4. Coherent modules can draw 3× more.
- •Always add optical power to switch base power. In high-density deployments, optics can add 30% to 50% to the total load.
- •Cable power counts. AOCs and active DACs draw significantly more than passive DACs.
- •Convert watts to BTU/hr. Every watt of electrical power becomes 3.412 BTU/hr of heat.
- •Design with margin. Size PDUs and cooling for 80% of rated capacity to handle peaks and growth.
- •Monitor DDM temperature. Thermal alarms usually indicate airflow or cooling problems, not bad modules.
Ready to optimize your 100G power budget? Explore Ascent Optics’ QSFP28 transceiver solutions and request a quote for your project. For help selecting the most efficient modules, read our guide on how to choose QSFP28. And if you are comparing cable options, see our QSFP28 DAC vs AOC analysis.
Frequently Asked Questions
Q1. How much power does a QSFP28 module consume?
Most QSFP28 modules consume between 3.5W and 5.5W, depending on their types. The SR4 and CWDM4 modules occupy the lower end of this range while the LR4 and ER4 versions consume the most power. Telecom-designed LR/ZR4 coherent CFP2-DCO/ZR modules rated 5.5W to 15W or higher can use more power.
Q2. How much power does a fully loaded 100G switch consume?
A 64-port switch fully loaded with QSFP28 modules typically consumes 700 W to 1,000 W total. The chassis base power is 450 W to 650 W, with optics contributing 250 W to 350 W.
Q3. Do QSFP28 cables raise the power-consumption needle as well?
Yes. Passive cables draw around 0.5 W or less, active DACs consume 1.5 W to 2.5 W, and AOCs draw roughly 2 W to 4 W. In large deployments, cable power can significantly increase your total load.
Q4. How do I account for cooling with QSFP28 deployments?
Multiplying the worth of electrical power in watts with 3.412 will give the rate in BTU/hr. An 800W power-consuming switch, for example, produces 2,730 BTU/hr of heat to be removed by the cooling system.
Q5. What is the DDM temperature at which it is too high for a QSFP28?
Alarm thresholds for QSFP28 modules typically range from 70–85°C, depending on the model. SR4 modules often alarm at 70–75°C, while long-reach variants like ER4 may tolerate up to 80–85°C. Consistently operating near the alarm threshold shortens module lifespan.
Q6. What’s the reason for my QSFP28 warming up?
Heat buildup is usually caused by poor rack airflow, high ambient intake temperature, or (rarely) a faulty module. Rule out airflow and cooling issues first, then test by swapping the module.
IEEE 802.3bm standards
ASHRAE Data Center Thermal Guidelines
Post Views: 1,156