A PAM4 module can pass every test on your bench and still ship a link with no margin left.
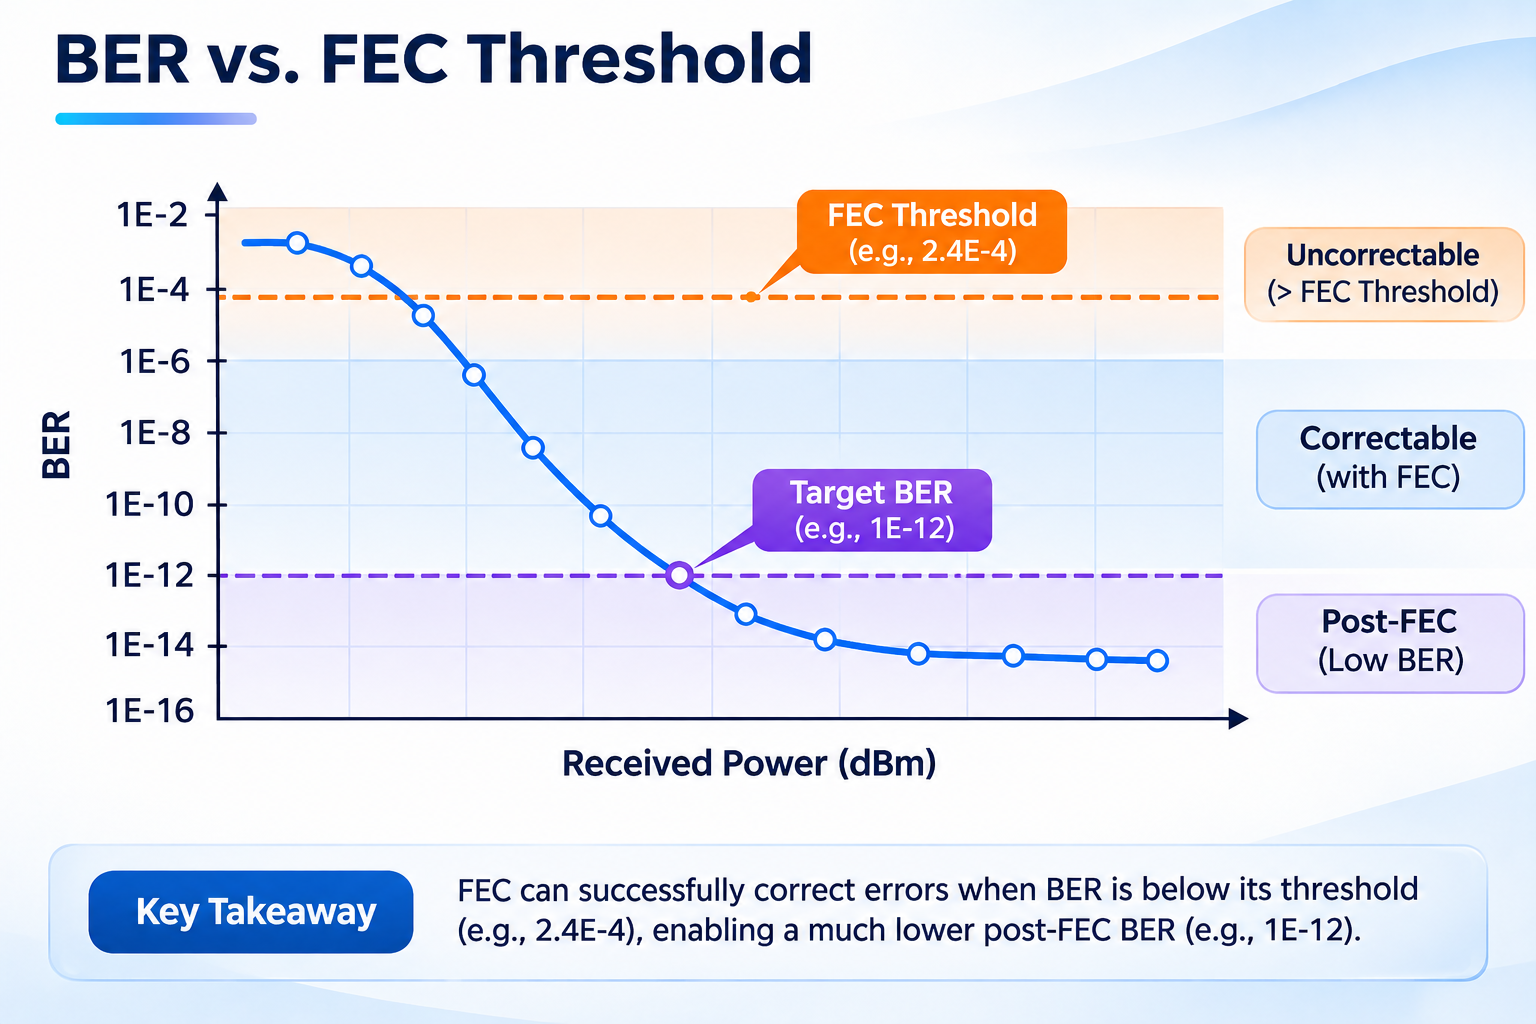
That sentence sounds like a contradiction. It isn’t. Forward error correction used by 400G and 800G Ethernet links can correct transmission errors, but a passing BER result does not necessarily guarantee sufficient operating margin. The number looks healthy. The margin is gone.
If you test optical transceivers, you already know the standard measurements: optical power, extinction ratio, TDECQ, BER. What’s harder is knowing which of those numbers actually predicts whether a link survives a hot aisle, a long patch panel run, and eighteen months of laser aging.
What Is PAM4 Testing?
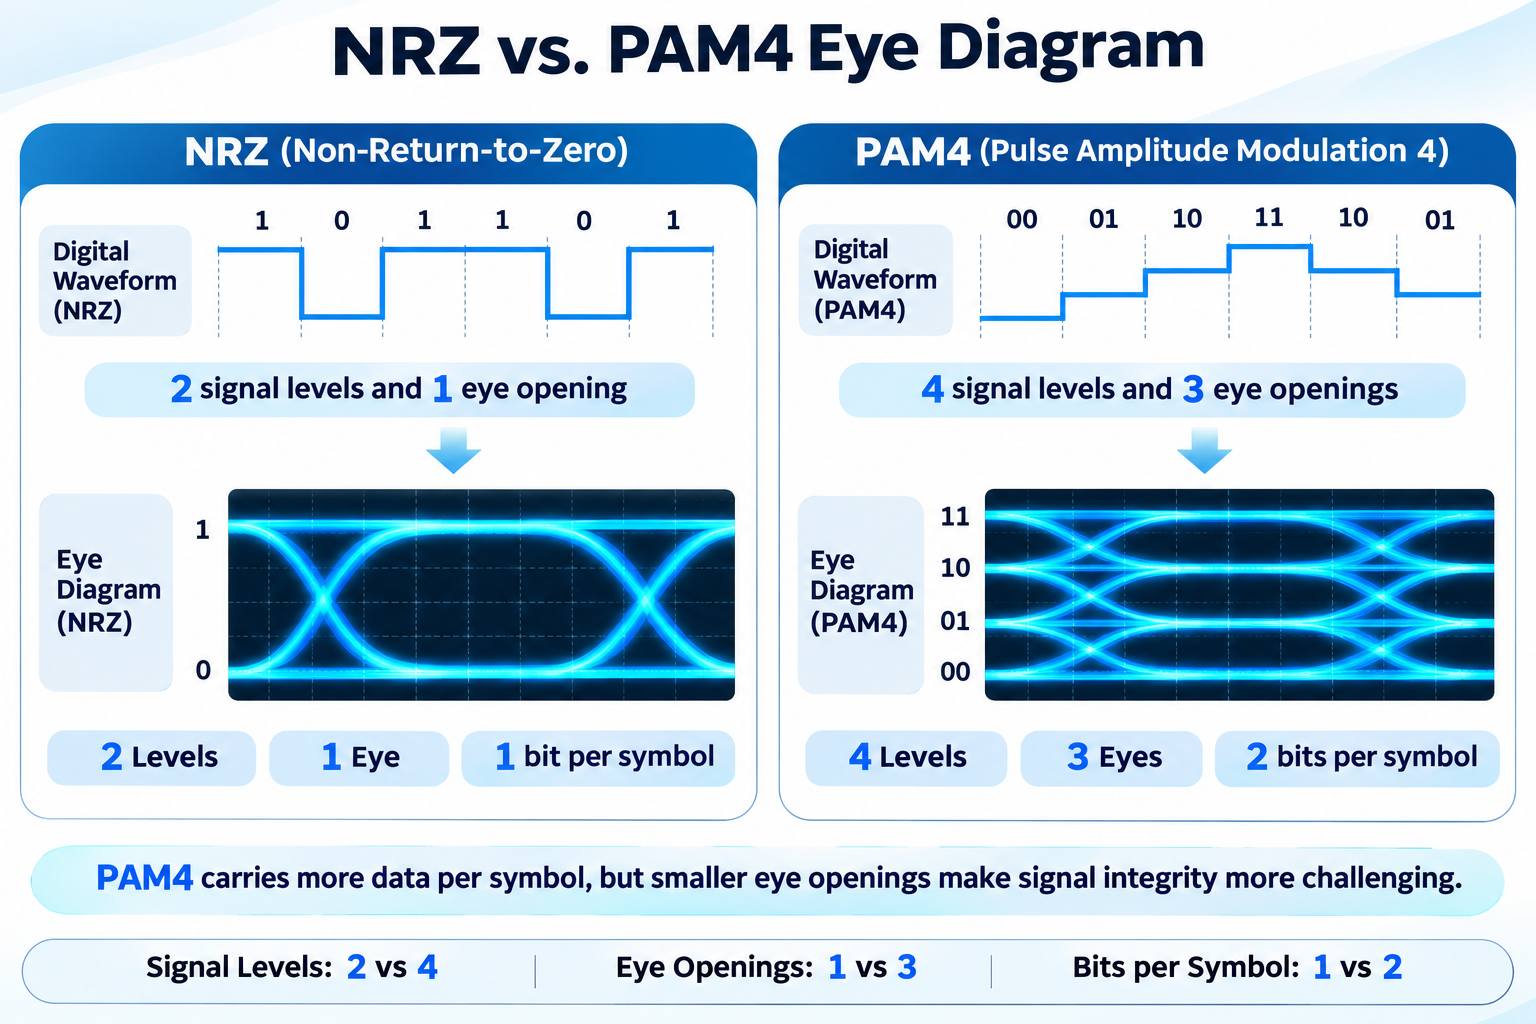
PAM4 testing is the process of verifying a four-level signal link against its standard. That covers transmitter quality measured as TDECQ, RLM, and OMA_outer, receiver performance measured as sensitivity and stressed sensitivity, and link quality measured as pre-FEC BER plus the FEC margin remaining after correction. Raw BER alone cannot prove a PAM4 link works.
The definition matters because PAM4 splits what used to be one test into three. In NRZ, a single bit error rate told you most of what you needed. In PAM4, the transmitter, the receiver, and the link each have their own metrics, their own limits, and their own failure modes.
Miss the split, and you get the classic result: a module with excellent TDECQ that fails in a switch, or a receiver that passes sensitivity but has almost no codeword headroom.
Why a Raw BER Number Is Not a Test Result
Here’s where most PAM4 testing goes wrong. An engineer connects a module to a bit error rate tester, runs a pattern, reads a number, and compares it to a spec. The number passes. The module ships.
The number was never the test.
Pre-FEC vs Post-FEC BER
Pre-FEC BER is the raw error rate on the physical link before correction. It reflects the link’s intrinsic quality: how clean the eye is, how much noise the receiver sees, how much the channel has smeared the signal.
Post-FEC BER is what remains after the decoder has done its work. This is what the host actually experiences.
Codeword Margin: The Number That Actually Decides
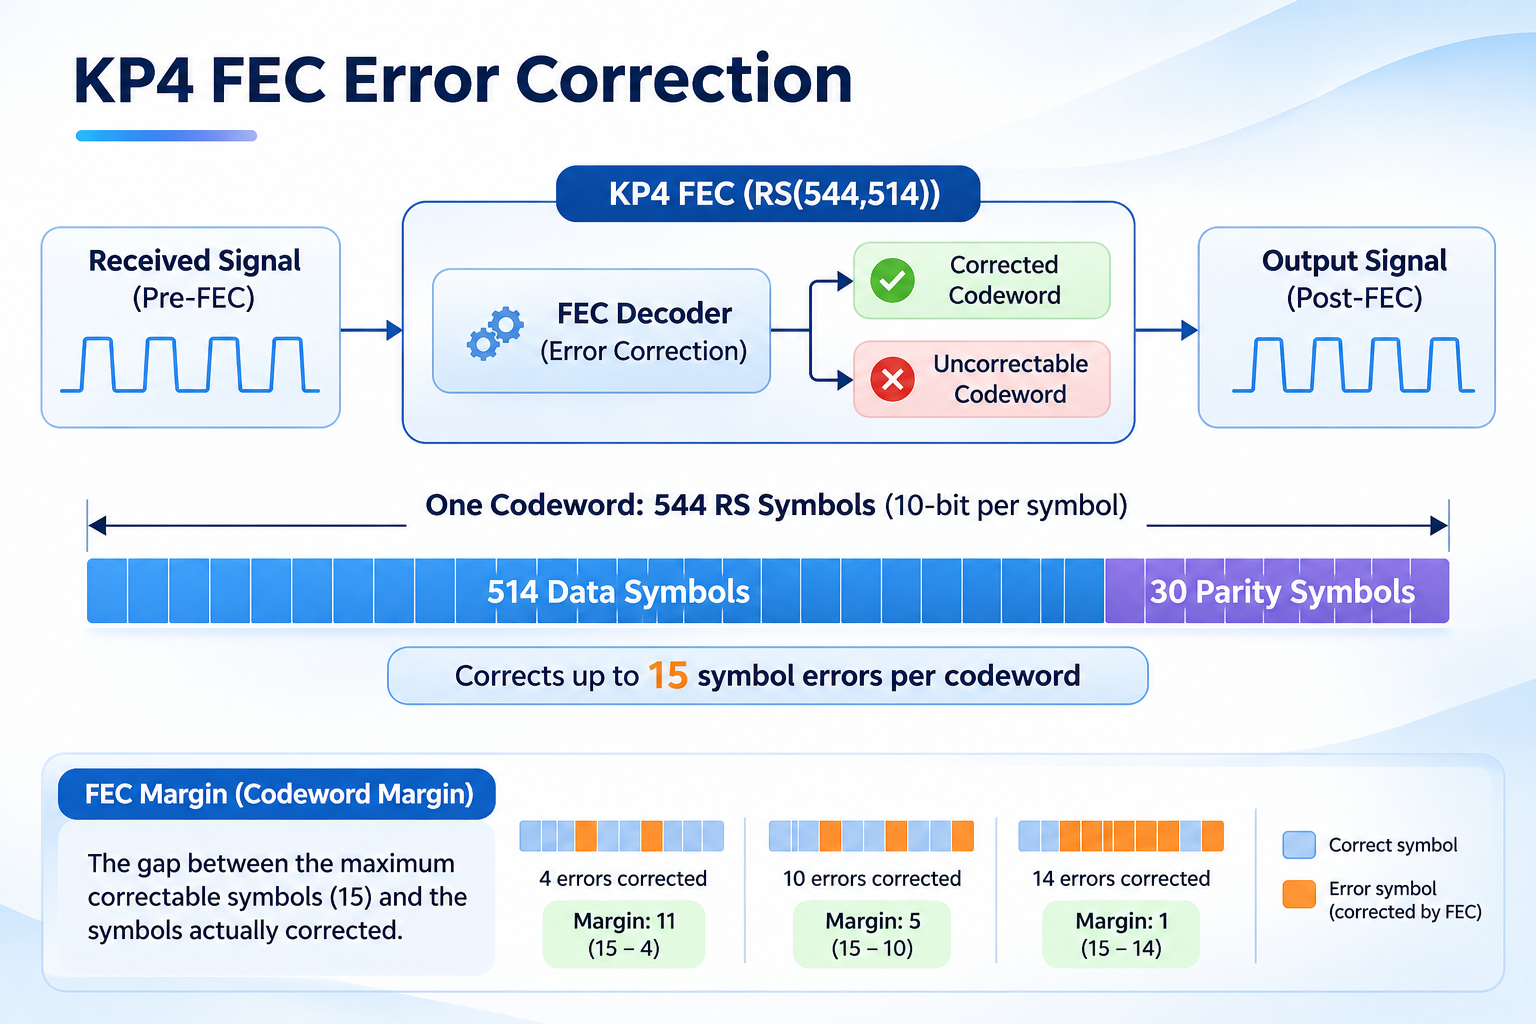
KP4 FEC uses RS(544,514), which can correct up to 15 erroneous 10-bit RS symbols per codeword.
At a pre-FEC BER of 1×10⁻⁴, a 5,440-bit codeword contains an average of approximately 0.544 bit errors, assuming independent random errors. This does not imply that most codewords are approaching the FEC correction limit.
However, average BER alone cannot fully describe link reliability. Correlated errors, error bursts, and the distribution of corrected symbols across codewords can significantly affect the probability of uncorrectable codewords.
FEC-aware testing should therefore monitor pre-FEC BER, corrected-symbol distributions, and uncorrectable-codeword counts rather than relying on average BER alone.
Error Distribution and Burst Length
Average BER hides one more thing, and it’s the one that breaks links: how the errors are grouped.
Burst errors can be more challenging for FEC than independently distributed errors because they may concentrate multiple erroneous RS symbols within the same codeword. Their impact depends on the error mapping, codeword boundaries, and any interleaving used by the link.
This is why the OIF electrical specifications define burst limits alongside BER limits. Depending on the reach class, they cap the maximum burst error length at roughly 15, 94, or 126 PAM4 symbols per 10²⁰ symbols transmitted. Two links with identical BER can have wildly different real-world reliability, and the burst limit is what separates them.
The Limits: What a Passing PAM4 Link Looks Like
The limits live in four different places, which is why they’re so often misquoted. This table consolidates them. Verify each against the current clause before you put it in a specification.
| Parameter |
Optical (100G/lane) |
Electrical (OIF CEI) |
Notes |
| Pre-FEC BER |
≤ 2.4×10⁻⁴ per lane |
≤ 1×10⁻⁶ (VSR/MR), ≤ 1×10⁻⁴ (LR) |
Optical limit aligns with KP4 correction capability |
| Post-FEC BER |
< 1×10⁻¹³ |
< 1×10⁻¹⁵ |
Inferred, not measured directly — see the duration section |
| TDECQ |
3.1 to 3.4 dB typical |
Not applicable |
Limit varies by PMD; check the clause table |
| RLM |
Not applicable |
≥ 0.95 |
Electrical transmitter linearity; optical uses TDECQ instead |
| Burst error limit |
Governed by FEC |
15 / 94 / 126 symbols per 10²⁰ |
Class-dependent; FEC cannot fix long bursts |
| Target SER for TDECQ |
4.8×10⁻⁴ |
— |
Exactly 2× the 2.4×10⁻⁴ pre-FEC BER |
One caution on the right-hand column. The 200G-per-lane work in IEEE P802.3dj is still in draft, and its target numbers are moving. Module data presented to the task force shows a KP4 threshold below 2×10⁻⁴ with operating pre-FEC targets in the 1×10⁻⁴ to 1×10⁻⁵ range. Treat every 200G/lane figure as provisional and dated until the standard closes.
Transmitter Testing: TDECQ, RLM, and OMA_outer
Transmitter tests answer one question: is this module’s output clean enough that a standard receiver can recover it?
The Reference Receiver Decides Your TDECQ
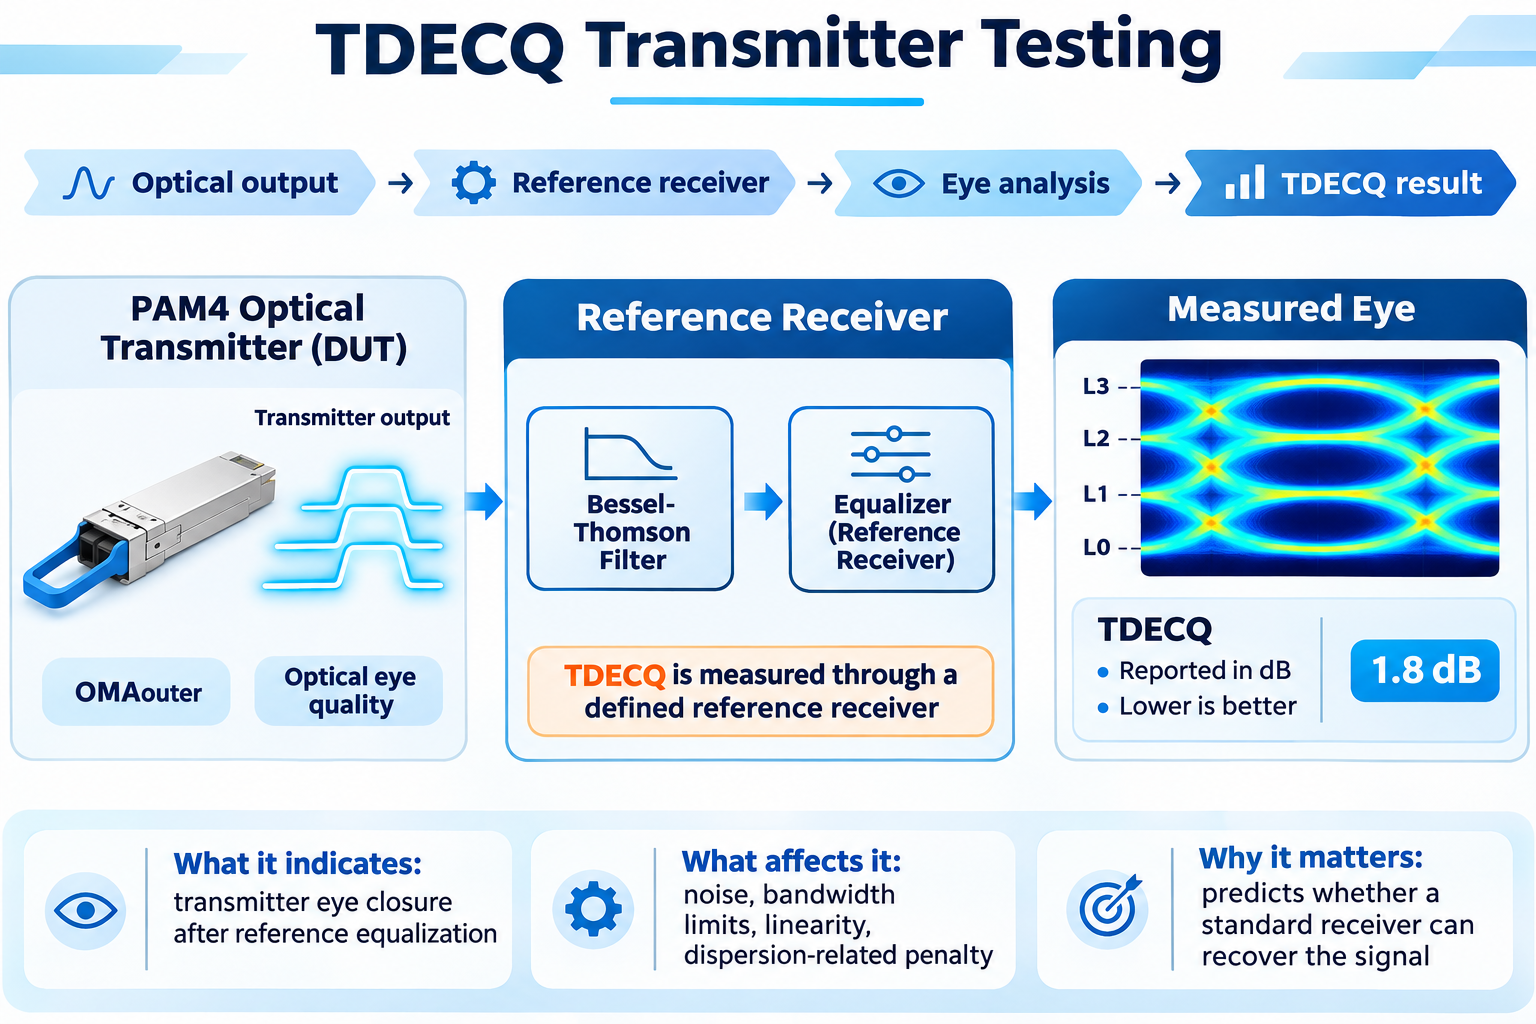
TDECQ stands for transmitter and dispersion eye closure, quaternary. It measures how much more optical power this transmitter needs than a perfect one to hit the target error ratio through a defined reference receiver.
The formula is:
TDECQ = 10 · log₁₀ (OMA_outer / (6 · Q_t · R))
Where Q_t is 3.414, corresponding to the 4.8×10⁻⁴ target symbol error ratio, and R is the tolerable added noise reduced by the equalizer’s noise enhancement.
That reference receiver is the part engineers skim past, and it’s why two benches report different numbers for the same module. The standard specifies a fourth-order Bessel-Thomson filter at half the symbol rate: 26.5625 GHz at 53.125 GBd, and 53.125 GHz at 106.25 GBd. It also specifies a symbol-spaced feed-forward equalizer, five taps at 53.125 GBd and fifteen taps plus a one-tap decision feedback equalizer under the P802.3dj work at 106.25 GBd.
Change the tap count, change the filter bandwidth, or let the equalizer search settle in a different place, and the reading moves. TDECQ is a specification, not a property of the module in isolation.
The practical consequence: when a vendor quotes a TDECQ number, ask which reference receiver produced it. A 1.2 dB difference between two reports is usually methodology, not hardware.
RLM and the Four-Level Check
RLM, the level mismatch ratio, asks whether the four output levels are evenly spaced. Uneven levels shrink one eye and grow another, and the smallest of the three is the one that fails first.
It’s computed from the eye heights at the two inner levels relative to the outer ones, and normalized so a perfectly even transmitter scores 1.0. The electrical minimum in the 50G, 100G, and 200G per lane electrical specifications is 0.95. An older, looser 0.92 figure circulates from early drafts; don’t use it.
RLM is commonly specified for PAM4 electrical transmitters, while TDECQ is a primary compliance metric for many PAM4 optical transmitters. The two metrics characterize different signal properties and are not interchangeable.
Overshoot, Undershoot, and Power Excursion
Three smaller checks ride alongside TDECQ and are read from the same captures without the reference equalizer applied. Overshoot and undershoot quantify ringing at the outer levels and are typically capped near 22 percent of OMA_outer. Power excursion caps short-term average power swings.
These rarely fail on their own. When one does, the transmitter is usually being overdriven or is bandwidth-starved, and TDECQ will already be showing the strain.
Receiver Testing: Sensitivity, Stressed Sensitivity, and SECQ
Receiver tests answer the other half: given a clean or deliberately impaired signal, how weak can the input get before the link breaks?
OMA_outer-Based Sensitivity
Receiver sensitivity and stressed receiver sensitivity are distinct parameters.
Receiver sensitivity characterizes receiver performance under defined reference signal conditions. Stressed receiver sensitivity evaluates the receiver using a calibrated impaired optical signal, including specified eye closure and other stress conditions.
For example, stressed receiver sensitivity limits include −1.9 dBm for 100GBASE-DR, −2.5 dBm for 100GBASE-FR1, and −4.1 dBm for 100GBASE-LR1, expressed in OMAouter. These values must not be confused with the corresponding unstressed receiver sensitivity specifications.
Both measurements must be evaluated against the applicable IEEE PMD requirements.
Stressed Receiver Sensitivity and the SECQ Penalty
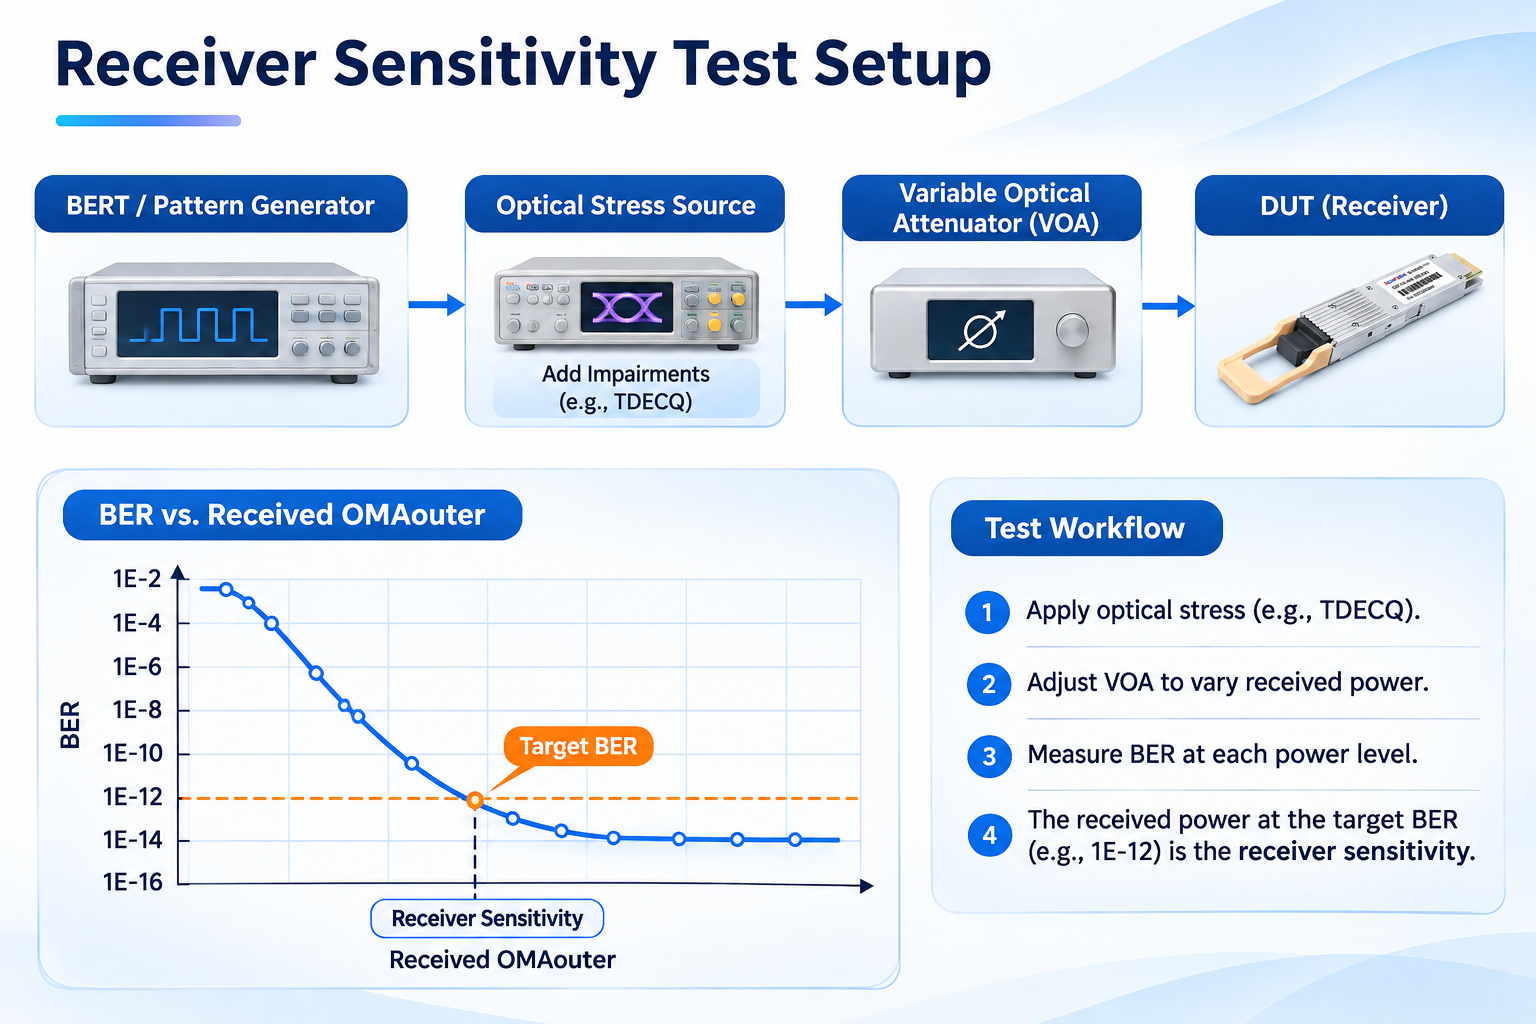
Sensitivity measured with a clean signal is a best case. Real links have penalties from dispersion, reflection, and transmitter imperfection. So the standards define stressed receiver sensitivity: the lowest OMA_outer at which the receiver meets its error criterion when fed a calibrated stressed signal.
The stress is built from a defined set of impairments, and the calibration is the fiddly part. SECQ (Stressed Eye Closure for PAM4) characterizes the eye closure of the calibrated stressed optical signal used for receiver testing. Its measurement procedure and reference receiver settings are defined by the applicable IEEE specification.
A receiver that passes clean sensitivity but fails stressed sensitivity has an equalization or front-end problem. It will work on a short patch cord and fail in the field, which is exactly the failure mode this test exists to catch.
The BER-versus-Attenuation Sweep
For link-level work, sweep attenuation and record BER at each step. The curve tells you two things: where the link crosses the FEC threshold, and how steeply it does.
A steep curve means the link is noise-limited and fails suddenly. A shallow curve means something else is limiting it, often a reflection or a marginal equalizer setting, and it will drift. Both fail. They need different fixes.
Test Patterns: PRBS13Q, PRBS31Q, and SSPRQ
The pattern you transmit determines what the test can reveal. PAM4 uses three, and choosing the wrong one is a quiet way to pass a bad module.
| Pattern |
Length |
What it stresses |
Where it’s specified |
Used for |
| PRBS13Q |
8,191 PAM4 symbols |
Fast equalizer adaptation, deterministic jitter |
IEEE 802.3, pattern 4 |
Transmitter linearity, some sensitivity tests |
| PRBS31Q |
2³¹−1 symbols |
Low-frequency effects, baseline wander |
IEEE 802.3, pattern 3 |
Receiver sensitivity, aggressor lanes |
| SSPRQ |
65,535 symbols |
Worst-case transition density |
IEEE 802.3, pattern 6 |
TDECQ acquisition, stressed receiver calibration |
SSPRQ is a standardized 65,535-symbol stress pattern designed to capture challenging PAM4 sequences within a manageable acquisition length. It is widely used in TDECQ and stressed receiver measurements. Its purpose is to provide repeatable signal stress rather than to represent typical random payload data.
A module that looks pristine under PRBS13Q can fail under SSPRQ. That isn’t a flaw in either test. It’s the reason production validation rarely relies on a single pattern.
How Long Does a PAM4 Test Need to Run?
This is the question that produces the most bad test reports, because the honest answer is uncomfortable.
The Three-Error Rule
BER test duration depends on the target error rate, the actual bit rate, and the required statistical confidence.
For a zero-error test, the one-sided 95% confidence upper bound on BER is approximately 3/N, where N is the number of bits tested, assuming independent errors and a stationary link.
To establish an upper bound of 1×10⁻¹⁵, approximately 3×10¹⁵ bits must be transmitted without observed errors. This requires about 7.8 hours at 106.25 Gb/s, or about 3.9 hours at 212.5 Gb/s.
The test must also distinguish between pre-FEC and post-FEC errors. Corrected errors do not count as post-FEC bit errors, although their frequency and distribution remain valuable indicators of link quality.
For very low target BER values, practical validation often combines statistical testing, FEC error counters, receiver margin analysis, and stressed operating conditions.
Debugging a Marginal Link: The Diagnostic Order
When a link comes up but won’t hold, guessing wastes days. Work the list in order. Each step rules out a class of causes.
| Symptom |
Likely cause |
Next measurement |
| No pattern lock |
Reference clock, CDR bandwidth, or host equalizer setting |
Verify the pattern and clock recovery configuration before touching the optics |
| TDECQ over limit on one lane |
Driver or laser issue on that lane |
Compare tap weights across lanes; a busy tap set points to bandwidth, idle taps with wide histograms point to noise |
| TDECQ passing, RLM failing |
Level mapping or driver linearity |
Recheck the four-level spacing at the electrical test point |
| Pre-FEC BER marginal, TDECQ clean |
Receiver side, or channel loss |
Sweep attenuation; a shallow BER curve points to reflection or equalizer setting |
| Errors clustered in bursts |
Channel impairment rather than noise |
Characterize burst length against the class limit |
| Passes at 25 °C, fails at 70 °C |
Thermal margin, not electrical margin |
Repeat the full test at the top temperature corner |
That last row is the one people skip. A module meeting its limits on a bench at room temperature has demonstrated room-temperature compliance.
Lab, Production Line, and Field: Three Different Tests
The measurements don’t change across these three settings. The coverage does.
Qualification runs everything: per-lane TDECQ, RLM, OMA_outer, overshoot, sensitivity, stressed sensitivity, pre-FEC BER, burst distribution, and the full temperature matrix. Days per design.
Production runs a fast subset that correlates with the full suite. Per-lane pre-FEC BER at a fixed pattern and power, plus a TDECQ spot check, catches most escapes in minutes.
Field runs whatever the switch can tell you. FEC counters, per-lane error rates, and DOM readings are the signals available, which is why per-lane reporting matters so much at 800G. An aggregate counter on an eight-lane module hides one bad lane behind seven good ones.
If a link fails in the field and the switch counters point at a specific lane, the next step is a bench test, not a replacement order. Our guide to QSFP-DD troubleshooting walks through the field-side diagnosis that gets you to that decision.
Frequently Asked Questions
What is a good pre-FEC BER for PAM4?
For 100G-per-lane optical links, the standard pre-FEC target is ≤2.4×10⁻⁴, which KP4 FEC corrects to below 1×10⁻¹³. A good number is well inside that limit with margin left in the codeword. Electrical interfaces use tighter targets: 1×10⁻⁶ for very-short and medium reach, 1×10⁻⁴ for long reach.
How is PAM4 BER measured?
With a bit error rate tester or a FEC-aware test instrument that generates a known pattern, compares the received symbols against the expected sequence, and counts mismatches. The pattern choice and the FEC mode matter as much as the instrument. Comparing raw errors without knowing the FEC state measures the wrong thing.
Why is BER testing not enough for PAM4?
Because FEC corrects errors, a passing average BER can coexist with near-zero correction headroom. Two links with identical BER can differ sharply in burst structure and in margin remaining. Codeword margin and burst length predict field behavior; average BER does not.
What is TDECQ and how is it measured?
TDECQ measures how much more optical power a transmitter needs than an ideal one to reach a 4.8×10⁻⁴ symbol error ratio through a defined reference receiver. The receiver is a fourth-order Bessel-Thomson filter at half the symbol rate plus a symbol-spaced feed-forward equalizer. The result is reported in dB.
What is the difference between TDECQ and TECQ?
TECQ measures the same eye closure without the worst-case test fiber in the path, isolating the transmitter alone. TDECQ includes dispersion penalty. Plugfest specifications also cap the difference between the two, which catches transmitters that depend on the fiber to look good.
What is the SSPRQ pattern used for?
SSPRQ is a 65,535-symbol pattern built to produce the worst-case transition density for PAM4. It is the required pattern for TDECQ acquisition and for calibrating stressed receiver test signals. It is deliberately more stressful than random data, which is why modules that pass under PRBS13Q can fail under SSPRQ.
How long should a PAM4 BER test run?
Long enough to observe about three errors at the rate you’re proving, which gives roughly 95 percent confidence. That is about 28 seconds for 1×10⁻¹² and about 7.8 hours for 1×10⁻¹⁵ on a single 106.25 Gbps lane. Because 1×10⁻¹⁵ is impractical to measure, post-FEC performance is normally inferred from pre-FEC BER plus error distribution and FEC emulation.
What is FEC-aware testing?
Testing that accounts for the FEC in the link rather than counting raw errors alone. It includes measuring pre-FEC BER at the correct threshold, characterizing error bursts against the class limit, and using FEC emulation or a real decoder to project post-FEC performance and remaining margin.
Post Views: 143